


Issue #33 - The Data Ecosystem Annual Roundup
Covering off all you need to know about the Data Ecosystem from 2024 (aka the TLDR edition)

Read time: 13 minutes
Welcome to the 2024 Data Ecosystem roundup!
Buckle up for the best of the best, covering the hottest and most popular topics you readers deemed worthy of reading in 2024.
Because, let’s be honest, you probably didn’t read every Sunday (if you did, I appreciate you ❤️), so it helps to have a little TLDR in your life!
What Have We Covered Since April?
This newsletter launched in April 2024. Since then, I have released 32 issues on various data topics (e.g., engineering, analytics, quality, etc.) and business topics influencing data (strategy, data investment, requirements gathering, etc.).
That being said, there is a lot more to cover!
The one bespoke infographic I’ve created this week is a map of the Data Ecosystem and some checkmarks to what I’ve covered so far. It builds on one of my first (and proudest) graphics from my third article where I laid out what I saw as the entire data ecosystem. Since then, I’ve adapted my visual style, so I thought it could use an update:
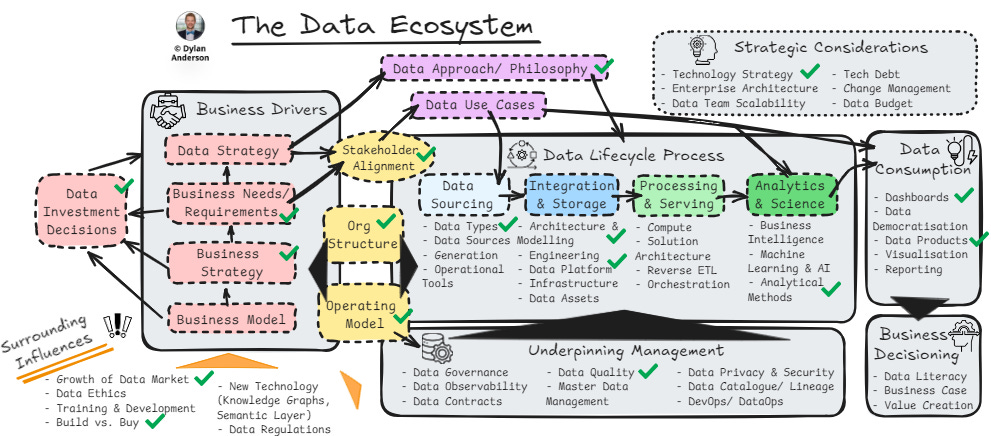
As you can see, we’ve covered many topics, but still have a lot to go. Things like ML & AI haven’t been examined in detail. While I outlined the technology space, I haven’t researched specific tools or platform components. Hell, I haven’t even done Data Strategy (and as a Head of Data Strategy, I should probably get to that).
So next year will be fun with all those topics. But for now, let’s focus on what we did examine in 2024!
The Top Five Data Ecosystem Highlights
Consider this your ‘Data Ecosystem Wrapped’. Or your Best of 2024. Or the most pressing issues on the minds of data professionals today.
Whatever way you spin it, I listened to the data, picked the top five most liked and viewed articles, and am laying them and their TLDR below, so you can catch up on what all you amazing subscribers ranked as your favourites! Let’s jump in:
1) What is a Data Product

Coming in at number 1 is the age-old question, “What is a Data Product?” This one got crazy good engagement because everybody relates to it. We’ve all heard the term data products (and probably asked to build or use them), but the amount of definitions around what they are creates so much confusion.
This article looks to create clarity where it didn’t exist before, hence why it was my most popular so far!
Read this if:
You work with data products daily
You don’t fully understand what a ‘data product’ actually is
You struggle to communicate the value/ benefits of data products to your business stakeholders
What the article covers:
The two different definitions of data products:
Data as a Product – A high-quality and reliable data set, model or access layer product, easily accessible via UIs, APIS and different access points. These products feed into analytical solutions
Business Focused, Analytical Data Products – A data tool or solution that specifically solves a business problem in an analytical context, providing direct value to the business consumer via insights or action
The holistically-focused definition of a Data Product in the Data Ecosystem
Tangible examples of Data Products and the value they create within an organisation
TLDR Summary:
When talking about Data Products within the Data Ecosystem, we have to think about all the people involved—not just data engineers, analysts, or scientists but also the business stakeholders who make data-based decisions
Therefore, in its purest sense, a Data Product must be a tool or solution from which end business users can draw insights and make decisions
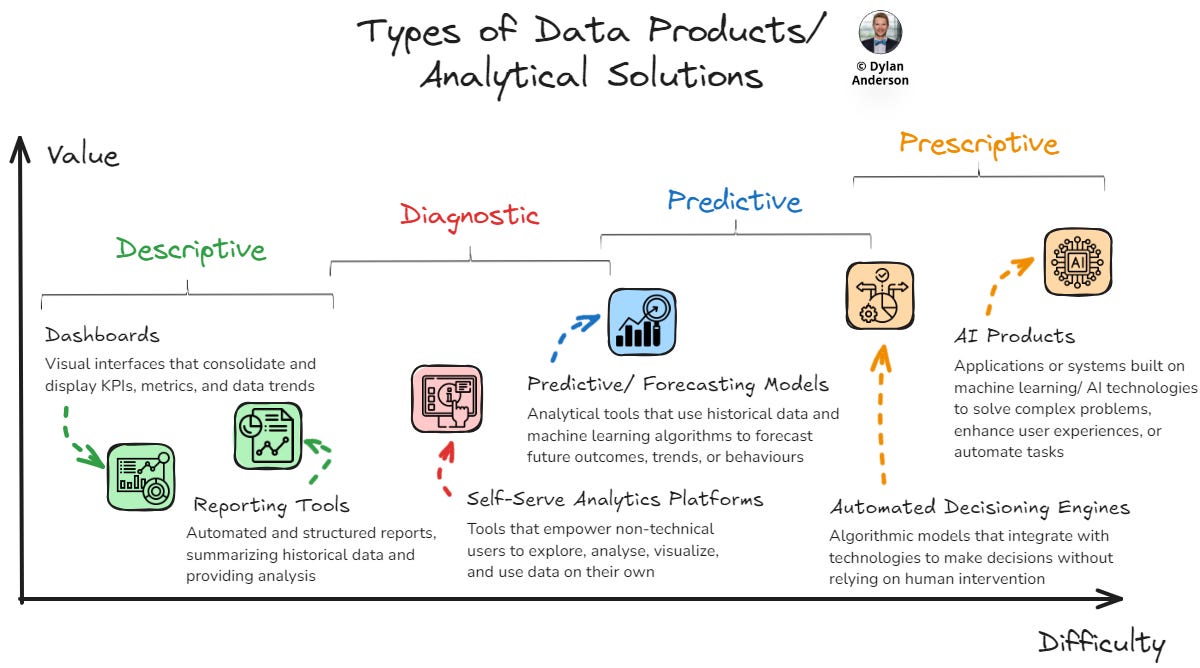
The six most popular types of Data Products include: (1) Dashboards, (2) Reporting Tools, (3) Self-Service Analytics Platforms, (4) Predictive Models, (5) Automated Decision Engines, and (6) AI Products
Also check out the other two parts of this series that talk about how to build data products in a scalable and effective manner:


2) Overarching Data Technology Strategy

Number 2 was an interesting one. I had to do a ton of research on this one, simply because NOTHING EXISTED on it! I find that mind-boggling—has no company built a data technology strategy, even though they spend millions on these tools?
I’m not a technology expert, but this allowed me to view the landscape from a holistic, strategic perspective. It’s not about what is out there or what companies spend the most on marketing. No, a technology strategy should be about what you need to succeed! And most people couldn’t define all the data technologies under the sun, so this article helps give you that foundation (and does it from a strategic perspective).
Read this if:
You want to understand the data technology ecosystem
You are thinking about adding tools but don’t know what you need
Your company buys new tech and tools without thinking about the purpose they serve (and it becomes a confusing mess)
What the article covers:
How to think about technology from a strategic perspective; think about your org/ data goals and the role of different technologies
The difference between Operational and Analytical data tools (trust me, this is huge)
Identifying the priority and role of each type of tool (they are not all created equal)
Things to think about when implementing and operationalising new technology
TLDR Summary:
Don’t buy data tools for the sake of it; (1) ensure they are aligned with your organisational and data tools, and (2) conduct a tech audit beforehand to ensure you are investing in the right things!
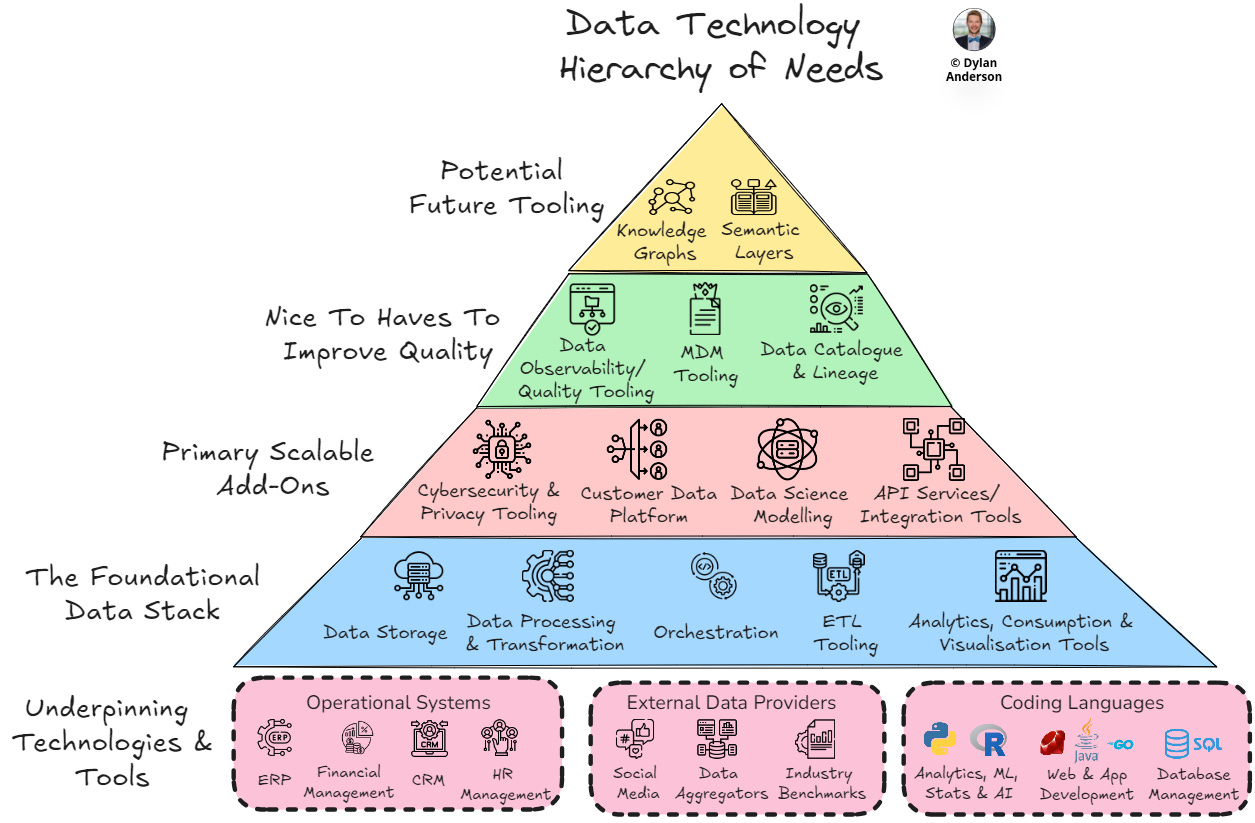
Not all data technologies are created equal, and they play different roles. There are four categories by level of priority that I’ve identified:
The Foundational Data Stack – Storage, Processing & Transformation, Orchestration, ETL, and Analytics & Consumption
Primary Scalable Add-Ons – Cybersecurity, Customer Data Platform, Data Science Modelling, and Integration Tools
Nice to Haves to Improve Quality – Observability/ Quality Tooling, MDM, and Data Catalogues & Lineage
Potential Future Tooling – Knowledge Graphs and Semantic Layers
Developing a strategy to implement is crucial. You must consider the short- and long-term with the entire architecture in mind. This might be a lot of upfront work, but it will create clarity and efficiencies in the long term.
I spent August and September learning a ton about technology, so there are some other great articles around the tech landscape and data platforms that align well with this one:


3) Data Operating Model

This was my first big article (it also got a big bounce back in popularity thanks to a viral LinkedIn post by Charlotte Ledoux). This topic originates from what I see as one of the three biggest data problems companies face.
A poorly constructed or non-existent Data Operating Model is the biggest reason I see for failure in data teams, which is a feeling that a lot of people have (hence the popularity of this issue). I work with many companies and have only seen a handful structure their operating model effectively. A lack of doing so leads to poor morale, reduced efficiency, and general confusion. So why not write about it?
Read this if:
You’ve felt your data team isn’t operating effectively with the business
You want to understand how to operate more efficiently
You need to showcase why your company’s current operating model isn’t working
What the article covers:
What even is an operating model, and the role it plays in an organisation
The most prevalent pain points in existing operating models
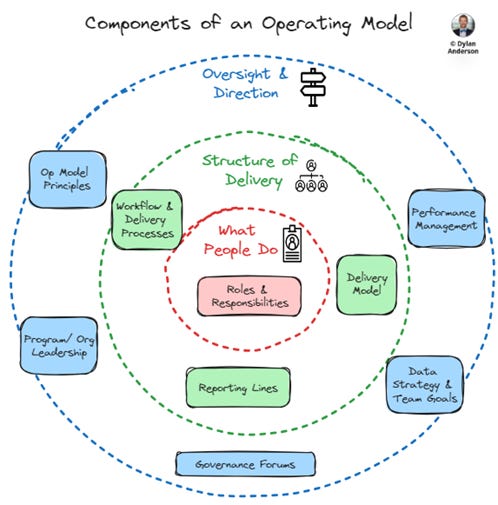
The three broad components of an operating model:
What People Do – The actual day-to-day of the data and business teams, outlining what needs to get done and by whom
Structure of Delivery – The overarching structure and flow that guides individuals to get things done
Oversight & Direction – The high-level principles, leadership and strategy that ensure the operating model is hitting on the right levels to deliver against the organisation’s goals
TLDR Summary:
A well thought-out Data Operating Model is integral; it defines ‘how’ you deliver on your data goals and overall strategy
The biggest reasons companies fail often come down to a poorly designed operating model. These include data silos, short-term thinking, a lack of standardised processes & measures across teams and poor cross-functional implementation/ delivery
Overall, it is a crucial framework/ approach that guides how the data & analytical function is organised and operates to deliver value within an organisation. This framework works across business domains and the data team(s) to provide a method for collaboration and coordination to support strategic objectives related to data
The Operating Model is one of those non-data, non-technical topics that data teams and leadership often forget about. This is my bread and butter when talking to execs and providing hacks to doing things better. Here are some other topics that fit into that category:


4) The Role of Data Modelling

This was my second huge article. It might be the increasing popularity of data modelling (Joe Reis is talking about it all the time now) or that many data modelling articles don’t get into the business linkage and benefits. Or maybe it was the fact that this article had my first Excalidraw infographic that went viral on LinkedIn.
Either way, I loved this article and learning about the topic.
Read this if:
You are in Data Engineering or work with Data Platforms
You want an overview of data modelling (a domain which is hard to grasp)
You are constantly wasting time on short-term data tickets because there is no long-term, structural data model
What the article covers:
What is Data Modelling and why it is so important
For reference, Joe Reis defines it as: A structured representation that organizes and standardizes data to enable and guide human and machine behaviour, inform decision-making, and facilitate actions
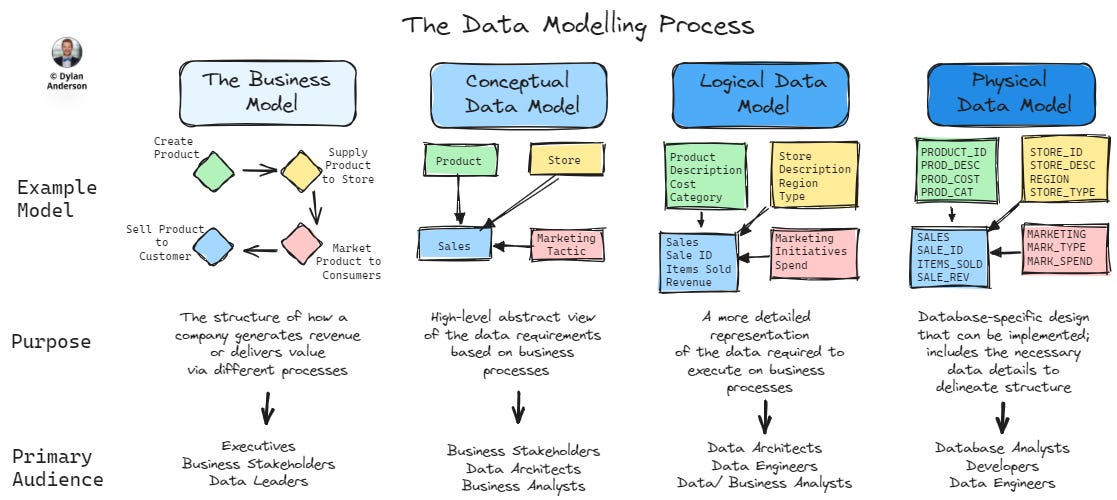
Defining conceptual, logical and physical data models, and understanding how it all links back to the overall business model
Outlining five different approaches to Data Modelling: (1) Kimball, (2) Inmon, (3) Data Vault, (4) One Big Table, and (5) BEAM (which is more of a requirements-gathering approach feeding into Kimball)
TLDR Summary:
A data model provides a comprehensive view of the organisation. It creates a shared understanding between the business and data teams, allowing data teams to build better pipelines, products/ assets, and solutions
Data modelling goes beyond physical data models and the technological side of matching data. Starting with the conceptual and logical data models helps translate the business needs into the physical database structure
It is crucial to understand various data modelling approaches to manage and leverage data in diverse scenarios effectively. Each method has unique strengths and weaknesses, making them suitable for different business needs and technical environments. You also don’t need to stick to one entirely, as mixing your models can provide more flexibility for your specific context & needs
Writing this article got me deeper into the need and benefits of Data Modelling and Architecture, not to mention Data Engineering. I want to write more on these in the future, but for now I put out two other posts you may find interesting:


5) Four Levels of Data Analytics

Picking the fifth most popular article was tight. But the four levels of analytics got a lot of traction with people, especially since everybody finds themselves trying to do some AI nowadays.
Whatever you do with data, it all comes down to creating value for the business. Hence understanding these four levels is paramount to communicating the insight data can deliver.
Read this if:
You work in analytics or with analytics teams
You are looking to plan out new data products
You want to better understand how to get value from data through analytical tools
What the article covers:
The real role of analytics in business (because it is more than just coding in Python or building dashboards)
A deep-dive into each level of analytics, including what it is, common forms and advice on how to properly do it
There is a ton of detail here for each level, which is helpful when thinking about a holistic data or analytics strategy, especially if you take a use case approach
How to think about building your analytics capability logically, instead of doing it with ad hoc projects that have no connection to each other
TLDR Summary:
Analytics isn't just about creating dashboards or running reports. It's about creating a systematic approach to understanding your business through data.
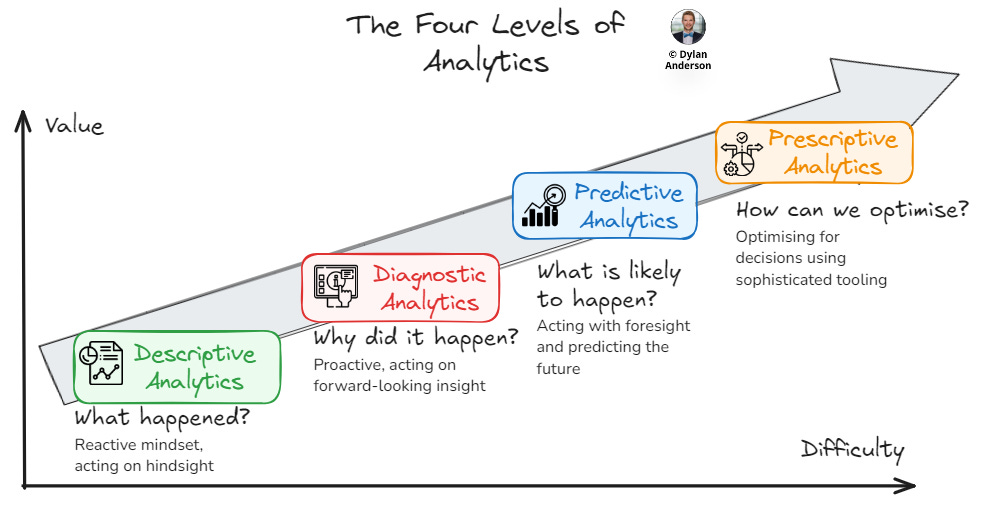
To understand your business through data, you need to think holistically and consider how each level of analytics builds on top of one another
Descriptive Analytics is the entry point where teams analyse and visualise historical data to provide a clear picture of what happened in the past
Diagnostic Analytics applies models and context to understand why things happened
Predictive Analytics use historical data and other variables to forecast future outcomes, trends, or behaviours
Prescriptive Analytics focuses on predicting what might happen and recommending actions to take to make the outcome more optimal
Whenever you are talking about analytics, you need to also think about what your stakeholders really want/ need and the metrics those analytics are driving. Here are two articles that will help you think about those topics as well:


Honourable Mention: The Data Quality Conundrum

I won’t go into detail about this article, but if you are facing Data Quality problems, check it out! This article and its predecessor touched a lot of hearts with the breakdown of data quality to its root causes, rather than playing at the symptom level, where most pain points are vented on.
What’s up for 2025?
32 down, 52 to go for 2025? Maybe a few extras here and there?
Well, I have a lot planned. Here are some quick hits of what The Data Ecosystem is looking to do in 2025:
More collaboration articles – I’ve got some articles in the works with Nik Walker (Head of Engineering at Co-op), Ben Rogojan (the SEATTLE DATA GUY if you didn’t know), Josue Bogran (Databricks Architect/ Engineer), and Ryan Brown (advocate about all things Data Value)
If you didn’t check it out, my first collab article with Mark De Jong went super well. He provided insight into standardising KPIs that I couldn’t have thought up!
Currently writing a 5-part Machine Learning & AI series that should go out late January-Feb. We will go from the fundamentals to what’s next in AI!
Honestly, it’s time I finally tackled this subject as it is all people are talking about…
Early next year I will finally do my ‘what to know’ post (or series of posts) about Data Strategy
Planning interview/ therapy sessions with Data Leaders that I will collate into learnings for all
And, of course, more great Data Ecosystem topics like Data Governance, Reverse ETL, Master Data Management, Change Management, and more!
But we still have two weeks left of 2024, so let’s not jump into 2025 just yet. Next week, I’m taking a break from Data to celebrate the holidays, but the week after, we’ve got The Data Ecosystem’s Top Ten Data Trends for 2025! I work across industries, clients, and data domains, so these trends should be more holistic than most. Not to mention, I’m not peddling any technologies or companies, so don’t think of this as a sales pitch. Hopefully, it gives you some insight into what will come about (even if I’m wrong, which I will be in some respects).
Otherwise, have a great holiday everybody and thanks again for all your awesome support this year!
Thanks for the read! Comment below and share the newsletter/ issue if you think it is relevant! Feel free to also follow me on LinkedIn (very active) or Medium (increasingly active). See you amazing folks next week!
What tool do you use to create your visuals in the article?