Issue #20 – Mapping the Data Technology Landscape
The technology in data that you need to know about
Read time: 12 minutes
Data people love talking about their tech stack.
They compare approaches.
They debate which tech is better.
They share technology horror stories.
And as the amount of data has grown, so has the tooling landscape. I mean, now it’s even hard to discern whether a name is a Pokémon or Big Data (I’m in data, and I loved Pokémon growing up, but I got a ton of these wrong).
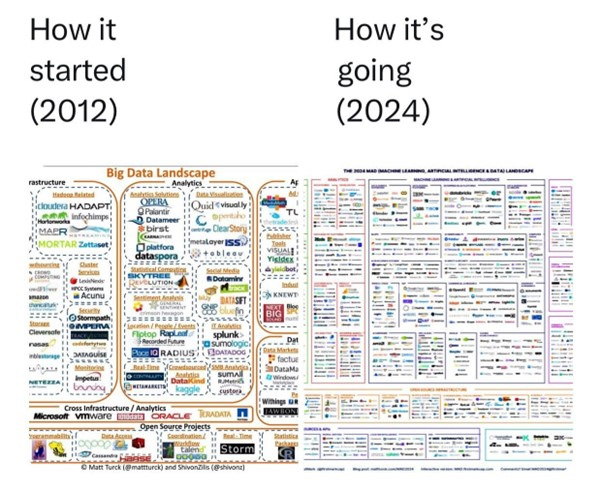
I’ve referenced Matt Turck’s MAD tooling landscape quite a few times (showing the 2024 version that is jam-packed with companies). Below is a view of how much busier it has gotten, going from a few hundred companies/ tools to thousands (and this doesn’t even include all the ones Matt didn’t put on the landscape):
While we can get lost in the weeds here, I go back to my favourite analogy about data:
Companies can’t see the forest for the trees.
Data thrives on the interconnectedness of its domains, and to truly grasp the industry's essence and potential, one must ascend above the tree line.
This is no less true for data technology. Hence, let’s map out the landscape simply and effectively.
Data Technology Landscape Categories
Given the existence of these 2,000+ companies and their unique tools, there must be a way to simplify this.
Especially because every vendor thinks they are the perfect fit to solve your problems. And now they all have added AI to their product to demonstrate its relevance…
So how do you cut through the fat?
The best way is to understand the key categories each technology should fit in to drive your organisational data goals/ strategy.
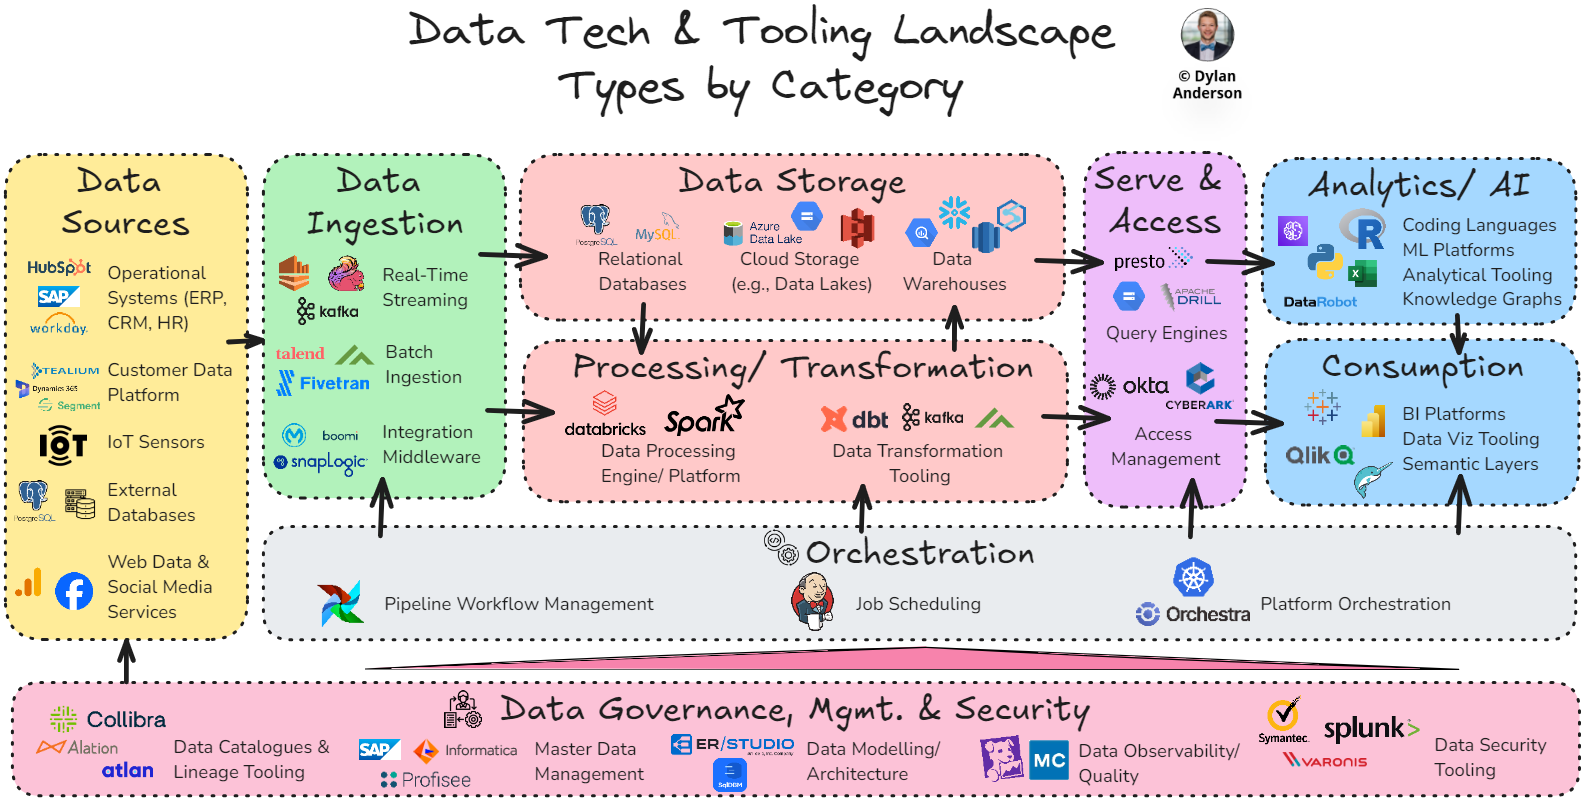
I have broken these into nine broad categories below. Each category includes multiple technologies, and technologies may span multiple categories as well:
Data Sources – Origination and generation of internal or external data to be used by the business
Data Ingest – Ingestion of source data into middleware that extracts, combines, cleans, and facilitates its flow into the data storage/platform
Data Storage – Storage layer for both raw and cleaned data; tooling may overlap with processing/transformation and serving
Data Processing & Transformation – Automation technology that integrates, cleans, and curates data as per the business needs/ use cases
Orchestration – Tools to automate the data flow, managing and scheduling workflows to ensure tasks are executed in the correct sequence and there is automated interoperability
Data Governance, Management & Security – Processes and tooling that underpins the data flow from source to consumption. Ensures data is properly managed, is secure/ compliant, and is governed properly to be accessible and understood by the business
Serve & Access – Operational layer of the main Data Platform that applies security/privacy rules and acts as the access layer for curated data
Analytics (including Data Science) – Applying analysis to convert curated data into business insights based on defined use cases
Consumption – Interactive tools that provide analysts and business users access to visualisation, curated data and applicable insights

Breaking Down Each Technology Category
The art of simplicity is breaking something complex into component parts and dissecting it one level further to uncover the common-sense structure within the intricacies of everything.
For data technology, it is truly a mess of tools.
The above category structure helps define where tools fit in data, as each category is a crucial part of the overall value chain. While these categories are not MECE (mutually exclusive, collectively exhaustive), they provide the structure necessary to uncover why the tool exists.

Within each category, I have further broken down the types of tools, their definitions, and some popular example companies/ brands. When you hear about a popular data tool, you will think: “Actually, I know what that does!”
Before jumping into these categories and types of tools, I want to say that I am not an expert in all these technologies. If anything seems off, please comment or message me. Part of posting in public is getting feedback and learning from those with more experience!
Data Sources – The technology within this category is wide-ranging. Despite the variability within this category, understanding what technology types exist here is essential as it lays the foundation for how companies gather data and where it comes from
Operational Systems – The systems that keep the lights on and create data based on how they operate and work. The most popular forms of operational technologies are:
ERP (e.g., SAP, Oracle, Microsoft Dynamics)
CRM (e.g., Salesforce, Hubspot)
Financial Management (e.g., QuickBooks, Xero, NetSuite)
HR systems (e.g., Workday, BambooHR)
Customer Data Platform – This is kind of an operational system, but it is more holistic. It integrates and unifies customer data from various sources, allowing for more personalisation and segmentation with the capability to easily activate on those customised groupings (e.g., Tealium, Segment, Adobe, Microsoft Dynamics 365)
IoT Sensors – A catch-all for the different types of sensor technology (e.g., temperature, pressure, proximity) capturing data from physical environments and playing it back to companies
External Databases – Linked data to external sources. The technology involved here would vary based on the partner, but interoperability and secured transfer protocols would need to be ensured
Web Data & Social Media Services – Consider this a catchall category for the various types of methods companies can scrape data from the internet (e.g., Google Analytics) or get it from social media providers (e.g., Facebook, agency providers)
Data Ingest – Tooling to facilitate interoperability between different systems and ingesting varying types of data to a certain standard, bringing together disparate sources and systems. This category includes both the ETL process tooling and the integration middleware platforms that are getting more popular (companies are realising they can’t just ingest data without some sort of integration logic/ application)
Real-Time Streaming – Ingest data continuously and process it on the fly. These tools are designed to handle high-velocity data streams, processing data as soon as it is generated (e.g., Apache Kafka, Apache Flink, Amazon Kinesis)
Batch Ingestion – Technology that specialises in collecting and processing data in batches (usually via ETL pipelines) at scheduled intervals from source to storage/ warehouse (e.g., Talend, Fivetran, Matillion, Airbyte, Azure Data Factory)
Integration Middleware – Acts as intermediaries to facilitate communication and data exchange between different systems and applications. Ensures that diverse data sources are integrated seamlessly and meet specific standards. (e.g., MuleSoft, SnapLogic, Boomi)
Data Storage – Infrastructure that stores raw and processed data, providing a point of accessibility for processing and for end users after it is processed. While it used to be stored in physical servers in company-owned on-premise databases, most data storage is now cloud-based
Relational Databases – Store data in structured tables with predefined schemas using SQL for querying and managing data (e.g., PostgreSQL, MySQL, Microsoft SQL Server)
Cloud Storage (e.g., Data Lakes) – Storing large amounts of both structured and unstructured data in its native format (e.g., Amazon S3, Google Cloud Storage, Azure Data Lake Storage)
Data Warehouses – Centralised repositories for storing and querying large volumes of structured data. Different from lakes, warehouses focus on storing clean and processed data, making it easily accessible for analytical or operational use cases (e.g., Amazon Redshift, Google BigQuery, Snowflake, Azure Synapse)
Data Processing & Transformation – Cleans and curates raw data, converting it into usable formats to facilitate further analysis. This takes the form of batch or stream processing
Data Processing Engine/ Platform – A unified platform to handle the transformation and processing of large-scale data sets. Interacts with storage and database tools to help analysts build, deploy, share and maintain processed data products/ solutions at scale (e.g., Databricks, Apache Spark). There is some overlap between these tools and Data Warehouses or ingest tools
Data Transformation Tools – Tools that clean, transform and enrich raw data into structured formats required for analysis and reporting. These tools are not necessarily a whole platform or a storage layer but operate with your other storage/ processing tech to improve the efficiency of any transformations (e.g., dbt, Matillion, Apache Kafka)
Orchestration – Manages and schedules data workflows, ensuring tasks are executed in the correct sequence. Apache Airflow is the most widely used orchestrator (it is also free and open source)
Pipeline Workflow Management – Manage data and dependencies across various types of tools to automate the execution of complex workflows. This ensures the data flow tasks (from extraction to transforming and loading) are carried out in the right order at the right time, especially within more complex environments where there are many tasks (e.g., Apache Airflow)
Job Scheduling – Monitor and schedule the execution of jobs within specific DevOps environments, ensuring that tasks are performed at specific times or intervals. This focuses on continuous integration and delivery (CI/CD) pipelines within the software delivery process and is more used for DevOps tasks (e.g., Cron, Jenkins)
Platform Integration Orchestration – Integration of multiple applications and services to automate different processes, coordinate environments, and handle differences between vendors & tools (e.g., Orchestra, Kubernetes). This technology type is still evolving as the use cases involved are quite wide-ranging in nature
Data Governance, Management & Security – Processes and tooling underpinning the data flow from source to consumption. Ensures data is properly managed, is secure/ compliant, and is governed properly to be accessible and understood by the business
Data Catalogues & Lineage – Facilitates data governance and metadata management by providing a searchable inventory of assets, data flow, and tracked transformations it goes through (e.g., Alation, Collibra, Atlan). A key tool to enhance data accessibility and collaboration for business stakeholders
Data Observability/ Quality Tooling – Monitors data pipelines and workflows to identify/ alert users of any issues. Helps ensure data quality, integrity and reliability within complex platforms with numerous data pipelines/ interactions (e.g., Monte Carlo, Acceldata, Datadog)
Data Modelling/ Architecture - Helps solve most organisations' need for more planning when structuring their data. These tools help align the business model with the conceptual, logical, and physical data models to design, visualise, and manage the structure of their databases and data systems, crucial in today’s complex data world (e.g., ER/Studio, SqlDBM)
MDM Tooling – Helps manage master data (critical data assets that are crucial to the business) by consolidating, standardising and making master data accessible, aiming to create a single source of truth (e.g., Profisee, Informatica, SAP)
Data Security Tooling – A catchall category of tools within the Data Platform to protect data from unauthorised access, encrypting data, data loss prevention systems, etc. There are multiple types of security tools across the data lifecycle, and deciding on the right vendor (e.g., Splunk, Symantec, Varonis) should be use case specific
Serve & Access – The operational layer of the main Data Platform that applies security/ privacy rules and acts as the access layer for curated data. Tooling here would overlap and/ or integrate with the warehouse, lakehouse or associated data storage
Query Engines – Allows users to execute queries against databases or warehouses to retrieve and manipulate data. This is often a feature contained within storage or processing tools (like a SQL database) but can be added on as well (e.g., Presto, Google BigQuery, Apache Drill)
Access Management – Controls and manages access to data and systems, ensuring users only see the data they are supposed to. This is especially relevant with increased security needs and data privacy regulation (e.g., Okta, CyberArk)
Analytics (including Data Science) – Facilitates and applies analysis to convert curated data into business insights based on defined use cases. The tooling suite overlaps significantly with consumption tools and processing & storage technologies
Coding Languages – Programming languages commonly used for data analysis, ML, and stats (e.g., R, Python, Julia, SQL). Each is underpinned by the hundreds of libraries (e.g., TensorFlow, PyTorch, etc.) that allow for custom solutions. This is not your classic SaaS paid-for tool but a free, open-source platform that data professionals should be proficient in. Coding is a must for analytics and data science (and engineering going back to the previous tooling)!
Machine Learning Platforms – Pre-built tooling (and programming language libraries) that specifically support developing, training and deploying machine learning models. The most popular ML platforms are extensions of open-source programming software & programs used by data scientists (e.g., TensorFlow, H20.ai, PyTorch). Companies exist that do ML and support its production as well (e.g., Databricks, Amazon SageMaker, DataRobot)
Analytical Tooling – Tooling with lower coding requirements that provide analytical capabilities to derive insights from data. Most of these are affordable, subscription-based tools (e.g., Excel, SAS, Alteryx, Power BI, Qlik) with significant overlap with BI Platforms and Data Viz tools. These technologies have a bit less flexibility than the coding languages above but are often easier to use/ pick up for non-native data users
Knowledge Graphs – A newer technology that aims to structure information in a graph database (visualised as a graph structure) about analytical and data science entities/ variables and their relationships (e.g., Neo4j, Stardog, Onotext). As advanced analytics gets more complex, this technology is meant to simplify and provide an understanding of how variables work together to derive insights
Consumption – Interactive tools that provide analysts and business users access to visualisations (e.g., dashboards, graphs), curated data and applicable insights. Meant as the source of business intelligence to make decisions on, but does overlap with analytical and data science tooling
BI Platforms – Interactive tooling that allows for data aggregation, analysis and visualisation by analysts and data-savvy business users (e.g., Tableau, Power BI, QlikView, ThoughtSpot, Looker). These serve as the basis for supporting business decision-making and allow users to pull data (often from SQL servers) and do their own analysis to draw out insights
Data Visualisation Tooling – Tools specifically designed for visualising data in graphs, dashboards, geospatial, or any other type of visualisation. These technologies might either be SaaS-type BI tooling (see examples above) or programming languages that focus on the creation of highly customisable visualisations (e.g., Plotly, ggplot2, D3.js)
Semantic Layers – Technologies that provide a business representation of what the data is and what it does within the organisation (e.g., AtScale, Looker, Dremio). They give business users a better understanding of the underlying data, increasing access and transparency. These tools can sit on top of BI tools, data warehouses and even pipelines
There you have it, the core technologies across the data lifecycle and typical data stack. This is a lot to take in, and the technology landscape is hard to define (it took me a lot of research and work), so if anything seems off, please do let me know!
And before you leave a nasty comment that I forgot this technology or this company, note there are thousands of more tools/ brands in the data space that do similar things to what I described above and are much more specialised in certain areas. I didn’t want to get into these niche technologies for brevity, but they can be extremely helpful depending on the use case.
Finally, note that you have to choose and implement these technologies strategically, understanding how they work with one another to help you achieve your organisational goals. For that check out last week’s article. Over the next two weeks, we will continue with the technology topic, diving into the Data Platform, defining what it is (it is an ambiguous term), what it does, and the different philosophies surrounding it. Don’t miss it as it’s a perfect article to build on your newfound knowledge of the data technology landscape!
Thanks for the read! Comment below and share the newsletter/ issue if you think it is relevant! Feel free to also follow me on LinkedIn (very active) or Medium (not so active). See you amazing folks next week!


A few tools serve across purposes. Some BI platforms come with their own semantic layers whereas others don’t. Some have their own preferred data storage layer to optimize performance. Some play ball with some kinds of databases more than the others. Some BI platforms are built for the embedding.
Request for next post: your favorite of each category. Bonus if they all integrate super well and you show a system diagram on how they all do so.