

Issue #35 – Streamlining Business Value with Reverse ETL
How to get insights from your data to business stakeholders in the way they want them (using their tooling)

Read Time: 12 minutes
At face value, if you hear the words Reverse ETL, you probably think “not another unnecessary data term.”
Yes, I will concede there are too many of those unnecessary data terms.
And I will concede that Reverse ETL isn’t the most straightforward name.
But beyond the confusing vocabulary, the concept has incredible merit.
Imagine you do all the hard work to source, clean, analyse and organise the data. You’ve got incredible insights loaded into a new, beautiful dashboard. Your output is going to change the game for your favourite business stakeholders.
Then reality hits:
Stakeholders don’t care about interacting with your data warehouse or dashboards to get the insights they need. Or they may be intimidated by them (because they aren’t familiar/ Excel)
Your dashboards don’t directly lead to action; the insights might be great, but they are hard to use because they aren’t in the tools people use (like CRMs, CDPs, MAPs)
Leadership doesn’t see the value in your work because it’s not tangible enough
Unfortunately, this is all common.
So how do we solve these three realities and demonstrate the value of our hard data work to business stakeholders?
Well, in today’s article, we will help explain what (for data’s sake) Reverse ETL means and why the concept (and practice) is not just a trend and needs to be a core piece of your data infrastructure!
Operational Tools Are More Than Data Sources
To a data professional, tools like CRM, ERP, and Customer Data Platforms (CDPs) are mere data sources.
But for business users, these tools help them do their job.
These tools keep the lights on:
They facilitate transactions
They send out emails
They automate supply chain logistics.
Not to mention, your company spends millions on them every year.
How can business users be forced to learn how to read and use your customer segmentation model integrated into a dashboard when they only know how to use HubSpot or Salesforce to understand who their customers are? Not to mention, they spend all their time on those tools!
This disconnect is a fundamental reason business stakeholders don’t realise the benefits of data.
We can’t expect business users to learn data tools and dashboards just because you spent time building them and you say they ‘provide insight’.
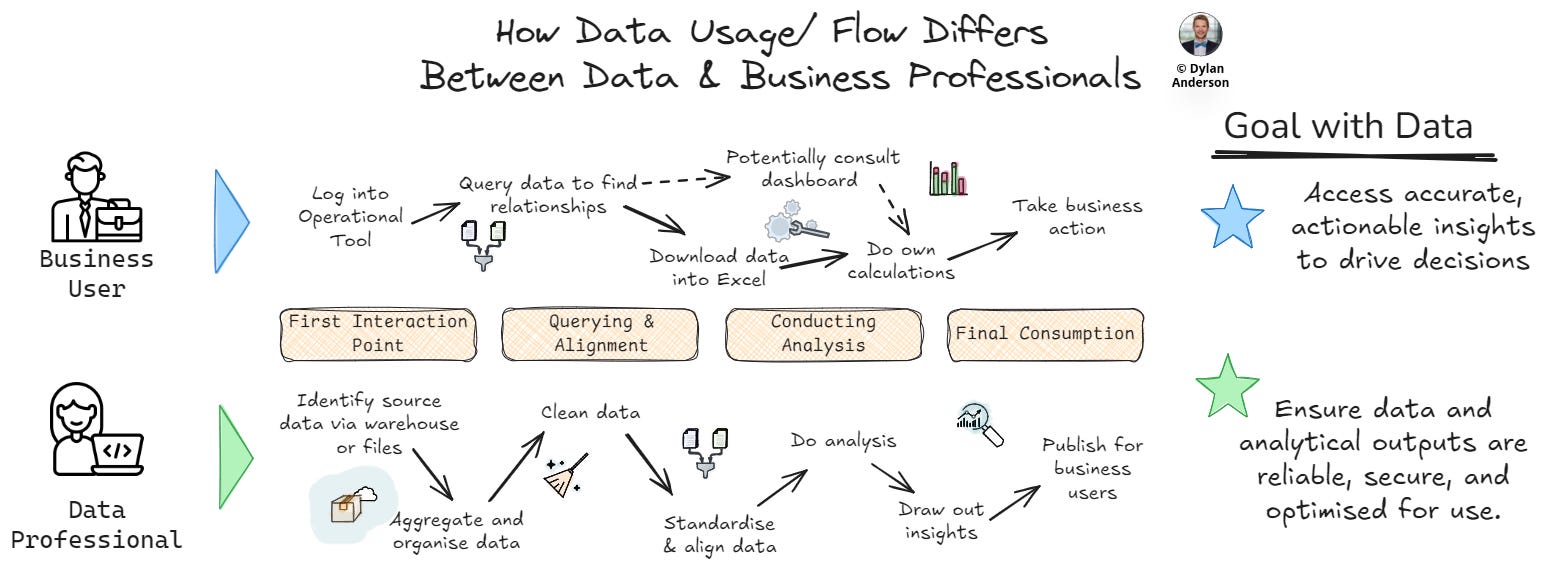
Even with a base-level understanding of how business users interact with operational tools and access data insights, you will be better placed to deliver value.
Otherwise this disconnect isn't just an inconvenience—it becomes a fundamental barrier to data adoption.
Operational Tools Directly Drive Tangible Benefits
That leads us to a second crucial point: operational tools drive action that offers tangible benefits.
The holy grail of business value is hard to quantify in data.
Data enables business insights, but linking it directly to revenue, cost reduction, or profit is an exercise in itself that requires effort and expertise that most organisations don’t invest in.
On the other hand, you have operational tools.
There is a reason the CFO so easily signs off on a huge Salesforce implementation—the tool is directly linked to customers, sales, and revenue. Tangible benefit is baked into the tool’s value proposition, and even non-data literate professionals can read and understand the data from them.
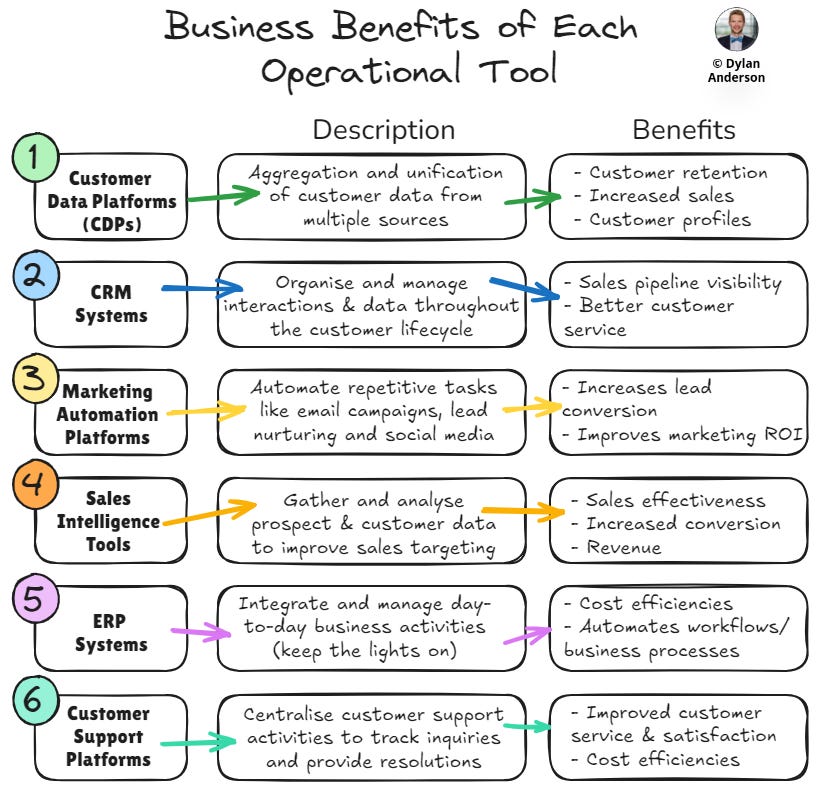
So what are the most common types of operational tools business stakeholders use?
Customer Data Platforms (CDPs): Centralizing customer insights
CRM Systems: Managing customer relationships
Marketing Automation Platforms: Streamlining campaign management
Sales Intelligence Tools: Enabling targeted outreach
ERP Systems: Automating core business processes
Support Platforms: Managing customer inquiries, track interactions, and provide support
The other point to consider is that SaaS/ operational tools haven’t been integrated into business operations for that long. Sure, CRM, ERP, and other tools have technically existed for decades, but their accessibility and functionality have only become user-friendly in the past 5-7 years.
What’s the implication of this? Well, executives are still wowed by the simple data analysis, visualizations and segmentation these tools offer. It is cutting edge in their minds, especially when it’s marketed as “AI-enabled insights.”
Now I’m not diminishing the value and relevance of these tools, but given companies are (1) bound to spend money on these tools and (2) are still astounded by what these tools do, there is little room for data to get the bandwidth it needs, especially if it’s a siloed, standalone function (which it often is).
This is a huge problem!!!! And integrating data insights back into operational tools isn’t just nice to have; it is crucial to success.
Hence, Reverse ETL.
The Reverse ETL Process Explained
Above, we explained why it is necessary to provide business stakeholders with data so they can act on those insights. Moreover, we identified the role of operational tools as an output of those insights.
This brings us to the increasingly popular data term that helps facilitate this process: Reverse ETL.
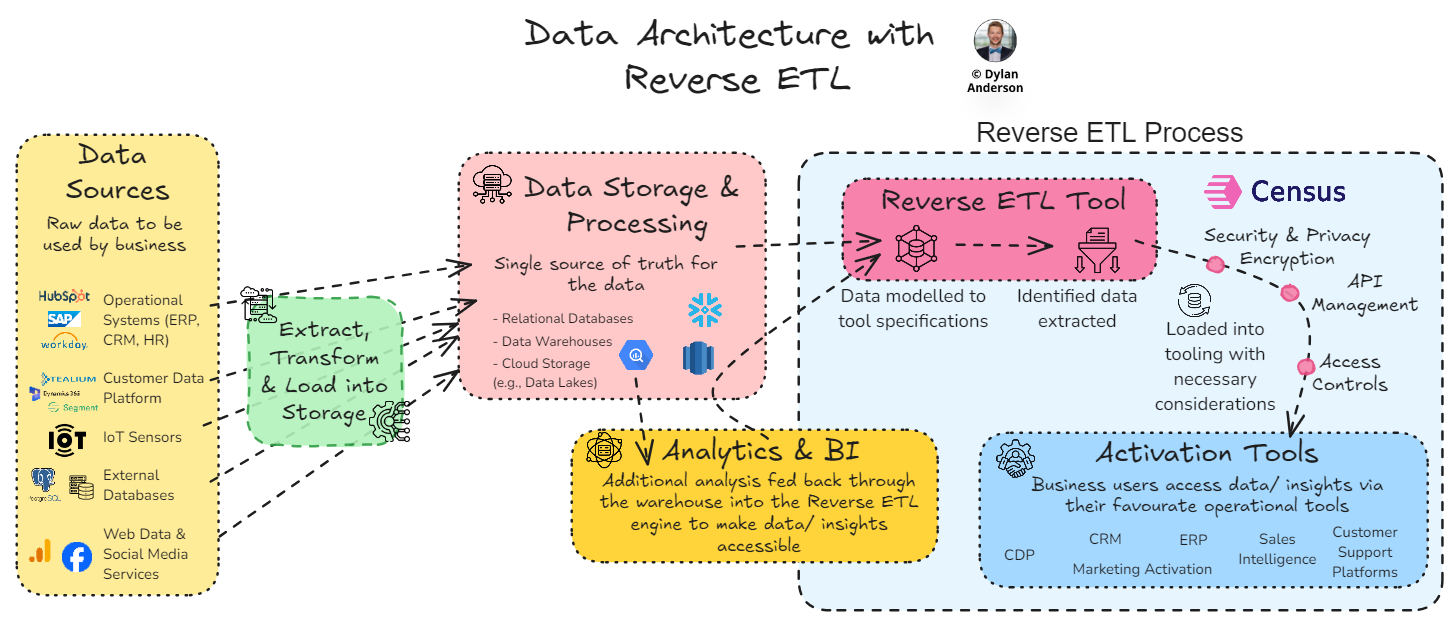
In summary, Reverse ETL is the process of syncing organised and analysed data from a central source of truth (such as a data warehouse) to operational systems used by business teams.
This automates stakeholders' access to data and insights within the tools they use every day and makes those tools more effective.
At a high level, there are two approaches you can take to do Reverse ETL:
Custom Built Pipelines
Purchased Tool
Historically, companies have manually siphoned data insights back to tools, building pipelines or APIs when necessary. With fewer data sources (and potential engineering bandwidth), this didn’t use to be an arduous task.
But as the amount of data and the number of users or tools requiring that data snowballed, so did the need for an automated solution.
So how does it work?
Well, whether you manually set up the connections or automate it via modern Reverse ETL tools, the logic is similar:
Extract the data from your data warehouse
Transform it into a specific way to match its target destination based on your org’s established data models/ definitions
Load it into target destinations, usually via API integrations or manual uploads
Activate and use the data in the tooling, monitoring the connection to ensure accuracy and delivery
That’s the simple overview. Unfortunately, simplicity is not common in The Data Ecosystem.
So let’s break down the how from both perspectives: (1) Manual Reverse ETL pipelines and (2) a Reverse ETL tool like Census.
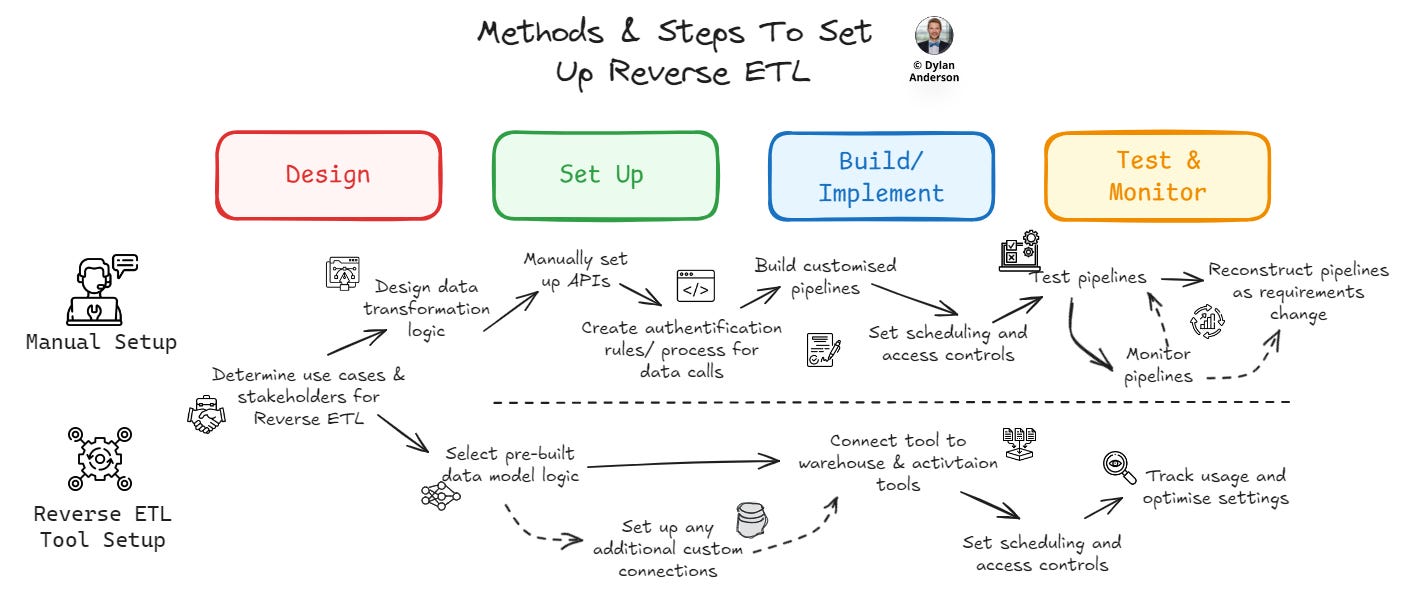
No matter which path you take, the first two steps should be somewhat similar:
Determine the Use Case & Stakeholder – Figure out what data/ insights need to flow back into which tool. Get the business stakeholder on board and define their requirements. Ensure this connection allows the user to take action from the data.
Source & Model Data – Identify data sources and determine transformation logic. Whether you approach it manually or via a tool, you must structure the data to map to the Operational Tools. Leverage the stakeholder input and the pre-built modelling structures Reverse ETL companies embed in their technology (if you go that route).
After sourcing and modelling the data, the work really begins. For a manual set-up, this requires a large effort by the engineering team to set up the pipelines, align the infrastructure, and monitor the connections:
[Manual] Set up APIs & Authentication – Understand API requirements for destination tools. Build and test API calls to integrate with eventual pipelines. Set authentication and access rules to ensure data calls are compliant.
[Manual] Build & Test Pipelines – Based on modelled requirements, write customized scripts to facilitate data transfer. Automate the pipelines, setting the scheduled calls as needed.
[Manual] Test & Monitor – Set up customized testing and monitoring of Reverse ETL pipelines. Implement error handling and logging throughout the process. Update authentication, access, and security as necessary. Assign resources for pipeline maintenance.
The Reverse ETL tool reduces a lot of these manual resource requirements from the engineering team, reducing the setup time and simplifying the overall process:
[Tool] Connect Tool Based on Needs – Sync your Reverse ETL tool/ platform using pre-built connections with the data warehouse and activation tools. Set the scheduling, error handling and governance access controls. Ensure the set-up complies with security and privacy requirements.
[Tool] Optimise Tool Usage – Visual interfaces track usage and manage data fields. Based on error notifications, fix any integration faults as they appear.
As you may infer, the biggest difference between a manual solution and a purchased tool is the effort required to design, set up and maintain the connections between the data sources and the activation tools and applications.
If desired, a company should be able to do this manually with a well-structured data model/ architecture, an available (and competent) engineering team, and a manageable set of data.
Unfortunately, if any of those prerequisites don’t exist (and they often don’t), a manual approach might not deliver the value your business teams need. Not to mention the pain and tech debt of troubleshooting manual data pipelines and keeping up with third-party API documentation/ changes (which are extremely cumbersome, especially for an overburdened engineering team).
In the end, the point of Reverse ETL is to simplify the data activation process for business users. Automating this ensures consistency, reduces time and effort, and makes it easy to access insight without coding or learning some manual tool/ process. A great case study I came across is S&P Global, which uses Reverse ETL tooling to ensure individuals across business units can access valuable data in a consistent format. For them, automation is crucial because of the amount of data and diversity of stakeholders that need these insights via operational tools.
Next, let’s evaluate how you should approach Reverse ETL in today’s data world.
Reverse ETL in Modern Data Architecture
With the ‘Why’ and the ‘What’ covered off, it’s time to think about ‘How’.
To start, one thing I want to underscore is: The Reverse ETL process is useless if you don’t think about it (1) strategically and (2) within the realm of your data architecture.
We’ve mapped out the technology architecture of the data ecosystem before, and frankly, it's complex! Add another tool that creates circular connections between technologies, and that complexity only increases.
So when thinking about Reverse ETL, reflect on these six considerations:
The Overarching Data Model – The data model is the foundation for your data workflows. Any Reverse ETL connections should be built with this in mind. This includes not just the physical connections but also the conceptual and logical data modelling that outlines how data fits within the business processes. After all, Reverse ETL is about connecting the data to tools that inspire action, so mapping the data flows to align with the business processes will increase the effectiveness of these connections.
Involved Technologies – The technology architecture must be reconstructed with Reverse ETL in mind. Below, you can see an infographic about how this might be represented. However, this is still high-level. The problem with real-world organisations is the existence of dozens of tools, often with duplicating purposes or owners spread out across the organisation. Invest time to understand what needs to be connected from the stakeholders themselves. Then, consider your data warehouse and source systems. Without that technology overview you will probably miss something and won’t get the right data into the right place for activation. Luckily, most tools have pre-built APIs and setup features that reduce the workload when integrating with a Reverse ETL tool, so once you have that figured out, the rest shouldn’t be too stressful.
Reverse ETL tooling is like a catalyst for getting your data insights from the warehouse or BI tools into your stakeholders’ hands Complexity of Data Integration – Point-to-point integration is often the standard approach in manual Reverse ETL architecture/ workflows. Managing this creates headaches for your engineers and architects and takes them away from high-value work. As the number of integrations grows, an Excel documenting these linkages isn’t going to work. Therefore, teams often evolve to Hub & Spoke models as the volume and complexity of data integrations increase. A great example is ClickUp, which uses a hub & spoke model to create a 360-customer view, combining first-party data across countless sources. These customer profiles are then directly linked to any GTM tool via Census to create that consistent customer view. Given they serve over 8 million users across 1.6 million teams, reducing the complexity of these integrations is crucial. All told, this approach has reduced their Customer Acquisition costs by 50%.
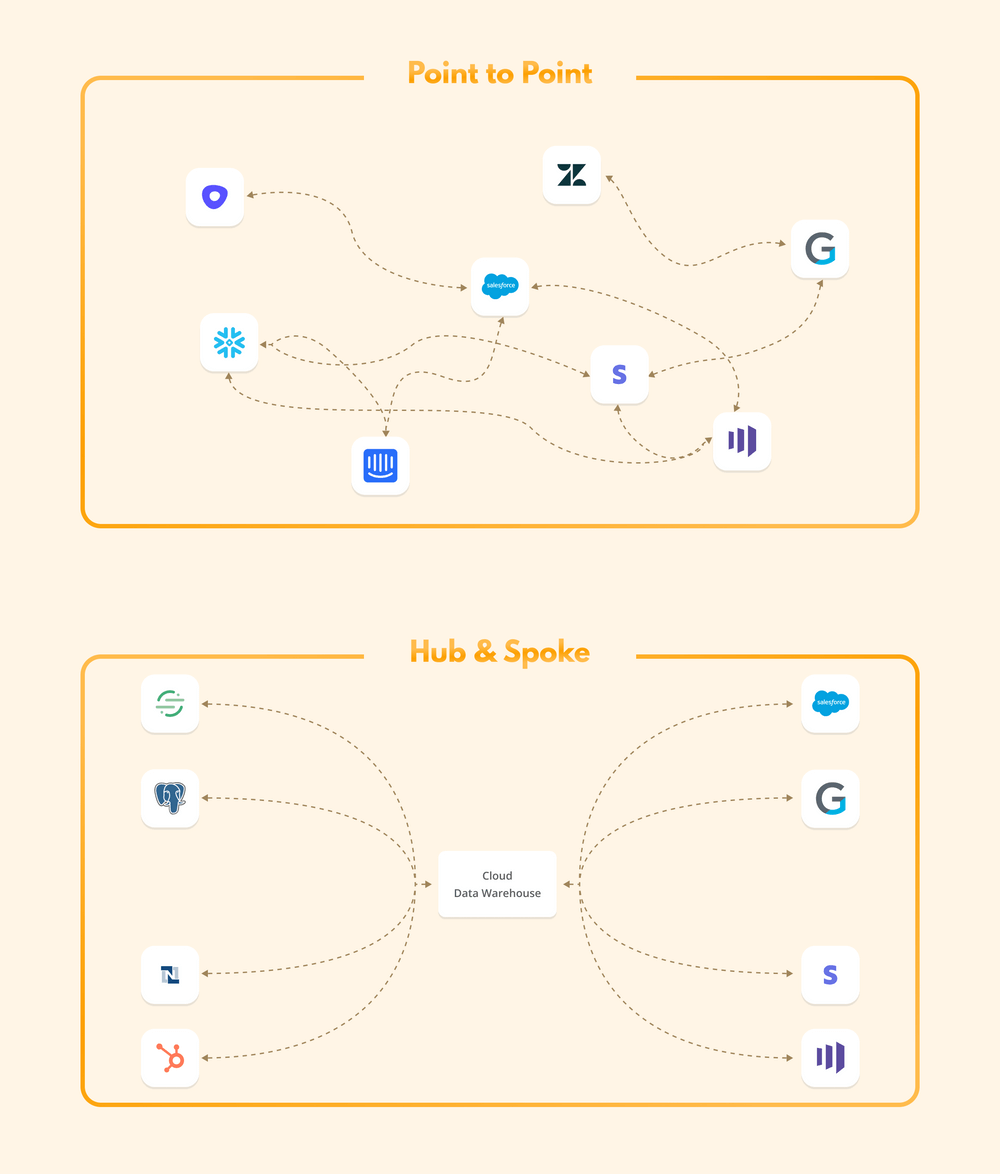
Here is a view of how a Hub & Spoke approach to integrations often makes things a lot simpler. Image source - Census


Resource Effectiveness – What resources do you have and how do you want to spend their time? Too many data engineers (and even scientists or analysts) spend their time doing low-value activities, like pulling CSVs for business stakeholders or servicing unnecessary tickets. Companies often build things they shouldn’t, taking away resources from higher-value activities (or causing them to leave in frustration). For example, pipelines don’t need to be custom-built whenever you spin something up. Products like Census’s Embedded product or Labelbox Catalog are designed to integrate pre-built Reverse ETL pipelines into a company’s user interface. Automating the building and maintenance of pipeline builds will improve your engineering team's output, effectiveness, and morale. So before committing to a new Reverse ETL tool, please work with your data team (especially the engineers) to identify how Reverse ETL will save time and make their outputs more impactful.
Compliance, Access & Security – Compliance requirements is the bane of every data person’s existence and is often a roadblock to creating value. Managing access or security gets even more complicated when considering multiple teams, data sources and technologies. Now, let’s introduce Reverse ETL, a process where you touch on every tool in the data and business teams. That skyrockets the complexity! Automating that and reducing the manual access-granting or authorisation configurations is crucial. Otherwise, doing Reverse ETL will be incredibly cumbersome. Don’t ignore things like data exposure security risks or data governance role-based access controls because these will come back to bite you!
Data Scalability – Two realities will always be true: (1) Change is constant, and (2) your data will increase. When implementing your Reverse ETL tool and designing the model/ architecture it slots into, don’t focus only on today. Instead, think about how the volume will scale, how data sources will be added, how AI/ ML will create new insight that needs to be fed to SaaS tooling, and how different teams will use data now and in the future. Scalability is a holistic mindset that links back to much of the other stuff we discussed. And with business stakeholders as your main beneficiaries of Reverse ETL, you need to think about scalability from their perspective.
Justifying the Need for Reverse ETL
My value proposition and LinkedIn tagline is “Bridging the Gap Between Data and Strategy.” This identity has benefited my career and ability to bring value through data for many organisations.
Unsurprisingly, any tool or data domain that helps bridge that gap is something I’m bullish about.
Reverse ETL hasn’t been on my radar for too long, but the problems it solves are common in most organisations I have worked with. Simply, anything that allows business stakeholders to take action more easily from data deserves to be part of an organisation’s tooling stack.
Unfortunately, most data people don’t think about these things because they understand the outputs from their own work… But that understanding doesn’t extend to actions taken by other teams.
Hence, data professionals think they are doing a bang-up job, while the rest of the organisation wonders what the hell they are doing in that black box.
Data is useless without action. So, no matter how you do it, make sure your data inspires action! If Reverse ETL is the answer, look into it. If it’s not, that is fine; just make sure you have an answer to the lack of action problem.
Thanks for the read! Comment below and share the newsletter/ issue if you think it is relevant! Feel free to also follow me on LinkedIn (very active) or Medium (increasingly active). See you amazing folks next week!
I partnered with Census to bring you this article. Rather than push their product, Census wants organisations to understand the benefits of Reverse ETL, which is why they were such a great partner to work with! Check them out here and engage with this article to support my newsletter (and keep The Data Ecosystem paywall from ever going up)
Back in the dark ages (1993) I wrote a book focused on the value of data in an attempt to move funding for data management from being a participant in the annual project funding melee to being funded as an asset of the enterprise. Our team went back through a decade of annual budgets of a telephone company to determine through time and motion studies the actual cost of organizing the physical assets in the telephone company's network on a cost per line basis and comparing it with the projected cost per line established on year one. The number of lines supported over the ten-year period had increased substantially and the technology had changed significantly but the data in the Line Information Database had been carried forward over the entire period.
As you might expect, the comparison between the actual cost per line and the projected cost differed significantly. We then calculated the average annual savings realized from having the data collected and organized and subsequently used the cost saving to determine the size of a bank certificate of deposit required to generate that amount of savings.
The size of the CD was over a billion dollars. Numbers like that have a way of grabbing the attention of upper management. Going through this process took a lot of time and effort, but it was valuable from two standpoints:
1. The funding approach to the data and the systems that used it led to changes in the way they were funded.
2. The method we used was easily comprehended by management, in part because both the approach and the numbers were not surrounded by any technobabble.
Dylan, what software do you use to make your charts and graphics?