Issue #4 - The Five Minute History of Data
The elevator pitch of data's recent history and why it matters
Read time: 6 minutes (I may have lied in the title…)
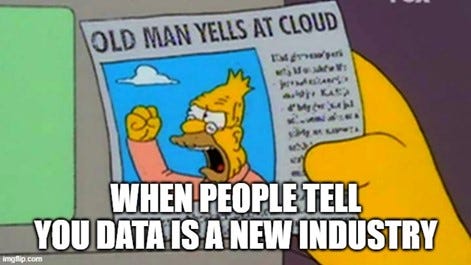
To an outsider, the growth of data and analytics within the business world reads like the classic human history within Earth’s existence chart (aka a blip in a long history of business).
But much like the history of humanity, the use of data has been evolving for decades if not centuries.
Why? Because data is everywhere.
Every sales transaction is data. Every note written down is data. Every survey question answered is data. And these processes have existed for centuries and underpin how the working world functions.
The difference today is that advent of digital tools and computer processing power has allowed us to better track, store, and draw insights from data than was possible with an abacus and a notepad. The value of data, and the inferences one can make from data, has therefore skyrocketed.
And like human progress, we are now seeing an explosion in interest, capabilities, and complexity.
The Evolution of Data
This newsletter edition won’t chronicle the history of data, but it will give a brief view of some key bullets and highlights. This helps us understand a few crucial questions that are worth considering in your daily data musings:
Why do different parts of the Data Ecosystem exist?
Why are some data functions more popular than others?
What is next in the data industry?
As data continues to evolve, how do we anticipate what is needed?
1990s (Popularisation of Computers & Data)
While the Internet was made public in 1993, this data decade was not defined by it. Rather, it was the operational use of computers and data that was the monumental change. The adoption of digital spreadsheets and database software allowed for more efficient record-keeping, inventory tracking, and access to internal data. A key part of that was the growing popularity of data warehousing, a technology that allowed organisations to store vast amounts of data in a central location. While data was recorded and stored (albeit very expensively), it was hard to access, both internally and externally. This made data analytics limited in scope and impact.
2000s (The Internet Era)
The dot-com boom brought data out from behind the closed doors of big organisations and all businesses started leveraging online data for marketing and customer service. Underpinning this was better data storage tools, open-sourced data processing tools, and better BI tooling. Analytics entered a new era too, where large companies were analysing web traffic metrics like click-rates and search engines were allowing companies to better target their advertising through the likes of Google.
2010s (Hyping Up Big Data)
As social media, IoT devices, and intercompany data increased, so did the volume of data. "Big data" became synonymous with a new era of data analysis, characterized by the 3Vs: volume, velocity, and variety. Every company became obsessed with using tools like Hadoop to collect and understand all that data (unfortunately most were not successful).
2012-16 (Data Science, The Sexiest Job)
Call this the ‘era of data science hype’, with companies hiring Data Scientists to build advanced analytical tools and machine learning products. The goal was to take the Big Data that companies had now amassed and turn it into smart insights. With promises of superior operations and decisions, large swathes of investment started to make its way into the industry creating the plethora of companies and tools you see in the ecosystem today.
2016-22 (Reverting to Data Engineering & Analytics)
Most data people also remember how ill-prepared companies were to do Data Science. With poor quality data siloed within organisations, companies transitioned from data scientists to engineers to build the pipelines and automate the cleaning of data to enable eventual insights. Meanwhile, analytics became the realistic option for getting instant value from data, with dashboards popping up all over the place in the name of better decision-making.
2023-Present Day (AI Everything)
Breakthroughs in user experience, data access, algorithms and access to extensive computing power has turned AI from a niche talent to a widely-available tool. ChatGPT revolutionised access to instant and smart insights from publicly available data, with organisations building on this and investing to create their own AI tools. AI products are continuing to improve with more access to unstructured & structured data, extension of types of AI (e.g., multi-modal AI, agentic AI, etc.), and improvement of the user experience leading to further adoption.
So what has really changed?
What you hopefully got from the above history lesson is that a lot has changed in the world of data over the past thirty years.
But why does that all matter? What has really changed? What do we need to take away from this?
To simplify, let’s break it down into four main themes that cover these questions:
First and foremost, data is now being generated, stored, and used at an obscenely high rate, and this rate is constantly increasing. Smart electronics means data is everywhere and can be used for everything (e.g., measurement, optimisation, teaching machines, etc.), creating an endless number of use cases (not all of them particularly useful). Underlining this growth is the fact that storage has gotten a lot cheaper, with most data now stored in the cloud.
The second big takeaway is the revolution in data processing. What used to be extremely complex has become simplified and made mainstream. Even the smallest companies can use technology like Databricks or Snowflake to process data and derive powerful insights without needing to hire experts to build it themselves. That being said, experts are still needed to navigate the complexity of the tooling…
Third, analytics within the data industry has shifted from backwards-looking to forward-looking. Data went from being collected and not used, to becoming instantly available via dashboards or automated reporting, providing a view as to what has happened and helping companies infer why it has happened. Quite rapidly, data is now providing insights to make better, future decisions through predictions or optimisation. The next step is automating those decisions with AI, although humans are still largely in the loop.
And finally, the remit of data has broadened and continues to evolve. Every company wants to know what the ‘art of the possible’ is because, truthfully, what data, analytics and AI are doing is nothing short of magic. Being able to understand human behaviour through data points, quantify it, optimise scenarios or outputs and, finally, automate it seems like fantasy-type stuff. Advances in AI, quantum computing, or digital twin simulation will continue to demonstrate new use cases and make all the stuff we discussed seem dated in a few years.
So with that, you have a brief view of how data has evolved over the past 30 years and the implications of that.
In the context of the Data Ecosystem, we can see why the industry has gotten so confusing, especially over the past decade.
Next week we will touch more on that, going into a second part on the growth of data and how we (as an industry) are beginning to lose our captivated audience.
Thanks for the read! Comment below and share the newsletter/ issue if you think it is relevant! Feel free to also follow me on LinkedIn (very active) or Medium (not so active). See you amazing folks next week!


